

Day trading is one of the most controversial topics in the investing world. There exists a lengthy list of prominent commentators who vehemently argue that day trading amounts to little more than gambling in the financial markets. These commentators vehemently believe that over long periods of time, active trading strategies will regularly underperform long-term investing.
The investing legend Benjamin Graham, renowned author of The Intelligent Investor, has described day trading as nothing more than “high-risk, short-term speculation”. However, with the development of the internet and the online trading platforms that have followed, it is now easier than ever for the average investor to begin day trading.
As such, we have prepared a general guide for new investors who wish to start learning about day trading in the hope that it will save them from some of the losses many traders incur early on in their careers. We will cover the basics of what you will need to begin day trading, as well as three basic strategies many new traders use to profit from the daily price fluctuations of the financial markets. Let’s get started!
What is Day Trading?
“Day trading” typically refers to the practice of buying and selling assets in the financial markets within a single trading day. Although it is possible to day trade any kind of asset on the public markets, day trading is almost exclusively conducted in the forex and stock markets. Ideally, those who choose to trade in the financial markets are well-educated and well-funded individuals who have the psychological framework and strategies in place to successfully navigate the financial markets.
It should be mentioned that day trading is different from other forms of trading like swing trading. The two forms of trading must not be confused with one another as swing trading violates one of the most essential day trading rules discussed below. The key indicator that someone is day trading is that their positions will be closed by the end of each trading day. Day traders will never hold any positions for longer than a single day.
Day Trading Rules
With day trading being such a challenging activity to succeed in over the long term, let’s look at three rules to help ensure the highest probability of success. Please note that these rules are not comprehensive and only intended to serve as a general guide that should filter into your trading strategy and psychology.
- Risk Management - Day trading can be a risky activity. You must manage your risk in every trade that you make. This means setting strict stop-loss orders and knowing exactly how much money you are prepared to lose on every individual trade. There is no shortage of stories of traders who suffered catastrophic losses by overleveraging their positions and refusing to manage their risk, do not be one of them.
- Close Positions - As we noted above, one of the key indicators that someone is day trading and not engaging in some other kind of trading activity is that they close their positions at the end of each trading day. It can be very tempting to keep losing positions open overnight in the hope that the next day will allow you to break even. Do not fall for this trap, take your losses quickly and close your positions before the close of each day. Stocks can take weeks, months, or even years to recover from falls and often continue to fall for some time before finding a bottom. Holding on to these positions over time will occupy your capital and may lead to you having an under capitalized account.
- Understand the Business - You should approach trading as though it were a business you were starting. It will involve long hours of work and study to ensure that your skills are sharp enough to cut some profit out of the markets you trade. Those of you who approach day trading as though it were a hobby to entertain you during your free time will quickly know the sting of failure.
Tools Needed for Day Trading
So, you’re ready to start day trading but not quite sure which tools you will need for the job? Let’s take a look at the tools every single day trader will need to begin day trading. It is important to note that tools are of little value to a tradesman who does not know how to use them. Therefore, we advise that you learn to use these tools to the best of your ability before putting any significant capital at risk.
- Brokerage Account - The first tool every trader needs is access to his/her brokerage account. Brokerages are our gateway into the financial markets. They are the means through which buyers and sellers are connected and trading is enabled. Choosing the right brokerage for you is an important decision and there are several fantastic options available to choose from. Although it is beyond the scope of this particular article to explore the various brokerages available, we recommend using our trading broker comparison page to find the right brokerage for you.
- Watch List - The next piece of equipment you will need to begin day trading is a tradable watch list. There are thousands of assets that can be traded in markets across the globe. As you might imagine, you can't keep your eyes on even a fraction of these assets. As such, you will need to assemble a series of assets and compile them into a watch list for trading. To assist you in assembling this list of assets, we recommend using a stock scanner. These scanners can be especially useful in helping you to identify possible trade setups. While there are many stock scanners available online, we always recommend TradingView’s stock scanner which is available for free on their website.
- Community - Day trading is a largely solitary exercise. We, therefore, recommend that traders find a community of traders online where they can discuss potential trade ideas, ask questions, and interact with other members of the day trading community. While there are some forums on sites like Reddit (r/daytrading), many traders are now using the community section of TradingView to discuss their day trades. If you are interested in learning more about TradingView and the charting services they offer, check out our article on them.
Start Day Trading With XTB
Did you know that XTB is one of the best platforms for day trading?
Is Day Trading Risky?
The shortest answer to this question is, yes, day trading is a risky activity. Ultimately, undertaking risk is an inescapable part of life. When day trading, the most obvious and consistent risk will be the risk of losing money.
Every trader, no matter how experienced or well prepared, will eventually lose money on a trade. This universal truth is brought to us by the sad reality that no trading strategy works indefinitely. However sophisticated, cleverly planned, or ingenuous you believe your trading strategy is, it will inevitably fail you at some point. When you are trading, you should simply try to be right more often than you are wrong. However, the amount of risk you take on when you day trade is entirely up to you.
Whichever strategy you ultimately decide to implement, the appropriate risk management techniques are some of the most vital aspects of trading safely. You should always ensure to calculate the amount you are willing to lose on a trade and set a strict stop-loss to ensure that your losses are limited if the market moves against you. By doing so, you guarantee that your risk is limited and you are safe from the catastrophic losses that take many traders out of the game.
Key Indicators
Technical indicators are mathematical calculations that use various metrics such as historical price data, volume, and open interest to forecast the direction of a specific market or asset. In other words, these indicators help you determine whether the price of an asset will rise or fall. Throughout this section, we will briefly examine three of the most widely used indicators in financial markets.
Support & Resistance
The basic concept behind support and resistance levels is a fairly rudimentary concept to understand. However, it becomes significantly more challenging to master when you begin to understand that support and resistance lines are found on various levels. For now, let’s look at the basic concept of support and resistance levels.
When we refer to a support level, what we are really referring to is the level where a stock will stop falling in price. Throughout a downtrend, the price of a stock will relentlessly fall in price. Sooner or later, these stocks will fall to a point beyond which the price seems reluctant to fall further. This point where the price of the stock is reluctant to fall below is described as a support level.
As I am sure you have already deduced, a resistance level is the opposite of a support level. Throughout an uptrend, the price of an asset will continue to rise. Eventually, these stocks will hit a point beyond which the price will seem reluctant to rise above. This point is described as a resistance level.
As a general rule, stocks will trade in between these support and resistance levels. Prices will constantly move between the levels, jumping off the support line when the price falls too low or bouncing off the resistance line when the price gets too high. This general rule will form the basis of our support and resistance trading strategy which will be discussed further below in this article.
Moving Average
Moving averages are used by traders who are attempting to determine the average price of an asset over some time. Moving averages can provide data on the average price of an asset over various periods ranging from 5 minutes to several months.
You may be wondering, why would traders be interested in the average price of an asset over a specific time? This information is useful as it can be used to help you determine where support and resistance levels might be found. Identifying support and resistance levels can be difficult as there is no guaranteed way of identifying exactly where these levels are. As a result, traders employ the use of other indicators to help them locate these levels. Now, let’s try to understand moving averages in the context of an example.
If we assume company X is trending upwards with a current price of 60$ per share. Its 50-day moving average is 50$ per share. This 50-day moving average is indicative of significant support at 50$ per share since the average purchase price has been around this level. Naturally, the further away the share price moves from this moving average, the more likely it is to hit a level of resistance. Similarly, the closer it moves toward the 50-day moving average the more likely it will cease falling.
While moving averages can be useful in determining levels of support and resistance, the price of an asset does not always move between these points. Prices regularly fall through support levels or smash through resistance levels. Beyond this, moving averages are calculated on historical price data. This means that no aspect of the indicator is predictive. As a result, moving averages can be random. There are occasions where the market appears to respect the moving average of an asset and other times where It does not. For this reason, you should always base your trading decisions on several different indicators as well as your own experience and intuition. When it comes to moving averages, each trader must determine for themselves how much credence should be afforded to the data provided by this indicator.
Relative Strength Indicator (RSI)
The relative strength indicator is used to estimate if a stock is on a bullish or bearish trend. Its fundamental purpose is to determine the speed with which traders are bidding the price of an asset up or down. In doing so, the RSI will plot the results of this data on a scale between 0 and 100. Generally, any readings below 30 indicate that the stock is oversold. An oversold reading means that the asset has likely endured too much downward pressure and is due to enjoy a price increase. Any readings above 70 tend to indicate that the stock is overbought. Similarly, this means that the stock has likely benefited from too much buying pressure and is due to suffer a price decrease.
As a result, many traders consider it a buy signal if an asset's RSI falls below 30 as they believe that this indicates that the asset is ready for a bounce. Conversely, many argue that an RSI above 70 is a signal to close their positions as it indicates that the asset has been overbought and is likely to begin falling in value.
However, it is crucial to note that the guidelines above are only intended to serve as a general framework for interpreting your RSI readings. When trading in the financial markets, it is vital to consider the wider market context within which that specific asset is trending before you enter a position. The overall trend of an asset is an important factor to consider when attempting to effectively interpret indicators such as the RSI. Let’s look at this in the context of an example below.
If we assume that you are interested in trading Apple (AAPL) stock. You will notice that, overall, Apple stock is always trending upward. Although it may have modest downturns from year to year, the overall trend of the stock is up. When interpreting your RSI reading on Apple stock, this overall trend will be a major factor to consider.
Since Apple is generally trending upwards overall, an oversold reading on your RSI is likely to be higher than the general rule of 30. On Apple stock, you may get a reading of 45 and determine that this reading is sufficient to conclude that the stock is oversold. Similarly, if you were interpreting your RSI in the context of a stock that had an overall downtrend, an oversold reading may be significantly less than the general rule of 30. For this reason, you should always interpret your indicators in the context of that asset's wider trend.
Top 3 Day Trading Strategies
This final section will cover three of the most popular day trading strategies that you can use to successfully trade in the financial markets. We will examine two general strategies that can be taken advantage of for any type of asset. Our third strategy will be more specific and focused on a particular chart pattern formation. Please note that the indicators discussed in the section above will be relevant to the strategies detailed below. We recommend you review these indicators in more depth if you are still unfamiliar with them.
Support & Resistance
Trading strategies that focus on support and resistance indicators are among the easiest to comprehend strategies that you can use. They are therefore excellent strategies for new and inexperienced traders to begin developing their skills and gaining experience with.
As you might already have summarised, the basic approach to trading support and resistance is to purchase an asset that is close to a level of support and then sell it once it has reached a resistance level. Similarly, you could also enter a sell position when an asset is reaching its resistance level and then close your position once it falls back to its support. In doing so, you would be able to profit from the price movements of an asset regardless of which direction the market was moving. We typically refer to this type of trading as channel trading since you are trading the asset within the pricing channel created by its support and resistance levels. Ideally, when you channel trade you would like to identify assets that have mainly traded sideways for a meaningful amount of time. Let’s look at what this might look like in practice.
When you trade using this simple support and resistance strategy, a number of indicators will help determine where these support and resistance levels may be located. Indicators like RSI and moving averages will be especially helpful when trading using this strategy.
For example, if you are trading an asset that is well above its 50-day moving average with an RSI reading of 81, this asset is likely reaching a resistance level. As such, this would be an excellent time to enter a short position and profit as the price of the asset falls back down to its support. Once the price falls closer to the 50-day moving average and the RSI begins to register in the low 40s, it may be safe to assume that the price is nearing support and close your positions.
Unfortunately, no strategy will remain profitable indefinitely. Eventually, assets will “break out” of their price channels and move either into higher highs or lower lows. As such, we always recommend placing stop-loss orders to protect your portfolio if one of these breakouts occurs when you have open positions.
When you are trading using a basic support and resistance strategy, we recommend you place your stop-loss order below support if you are entering a long position or above resistance if you are entering a short position. Doing this will ensure that your portfolio remains protected from significant losses in the event that the price breaks out of its previous channel.
Similarly, we also recommend that you set conservative profit targets when entering your trades. In this case, we would recommend setting your profit targets approximately 10% above the support line if you are entering a short position or 10% below the resistance line if you are entering a long position. For example, if you are entering a long position on a stock with a resistance level of $20, we recommend setting your take-profit order at approximately $18.
Scalping
The scalping strategy is designed to profit from minor price movements. The traders who employ this strategy will place dozens of trades in a single day under the belief that small price movements are considerably easier to capitalize on than larger ones. In short, scalping looks to profit from the minute price changes of an asset.
When scalping, you would open a position on an asset (either long or short) and then close the position very shortly after it becomes profitable. This position (either long or short) should be based on the previous trend. For example, if the price is climbing, the scalper would enter a long position and close it shortly after becoming profitable. The opposite is also true if the price were falling.
To operate this strategy effectively, you would need to ensure that you set the strictest of stop-loss orders to avoid significant losses. Scalpers tend to make very small profits over a large volume of trades. However, if you were to fail to place a stop-loss order on a single trade that moved against you, you could wipe out your entire day’s profit with a single loss.
The strict nature of the stop-loss requirements for using this strategy provides it with one of its greatest strengths. Since the scalping strategy has very tight stop-loss parameters, the capacity to incur significant risk when scalping is negligible, if not entirely removed.
The scalping strategy is also well suited for those of you who do not wish to understand the fundamental aspects of the assets you are trading. Since you are not required to understand the fundamentals of the asset you are trading, the time investment required to effectively scalp an asset is nominal.
That said, while scalping is certainly an effective strategy and is regularly implemented by both new and experienced traders, it is not without risk. Since the scalping strategy is a volume-based trading strategy, you will need to have the capacity to enter a larger number of trades within a single day. This will require a great deal of stamina on your behalf and will demand that you remain focused enough on each trade to ensure you continue to set strict stop-loss orders. You must remember when scalping that a single trade without a stop-loss order could eliminate all your profits for the day.
Naturally, since scalping is focused on the smallest of price changes in the price of an asset, if you are utilizing this strategy you will be best served by using the 1-minute or 5-minute charts. Further, scalpers will typically employ the use of indicators such as moving averages and the RSI to help them identify short-term price movements. For example, if the price of an asset is generally trending up but is currently below its 50-day moving average with a low reading on the RSI, this asset will likely move up in the short term. A good scalping strategy in this example would be to wait for the first green candlestick to appear on the 1-minute chart and then place a quick trade to scalp some profit from the climbing price.
ABCD Pattern
The ABCD pattern is one of the most recognizable price patterns and so it is regularly utilized by new traders. The pattern is comprised of four individual components each assigned a letter between A and D. The pattern indicates an upcoming trend reversal, this means that if a stock has been trending downward, the ABCD pattern indicates an uptrend is forthcoming and vice versa. For this article, we will be examining a bearish ABCD pattern which indicates that the rising price of an asset will soon begin to decline. You can see an example of a bearish ABCD pattern below.
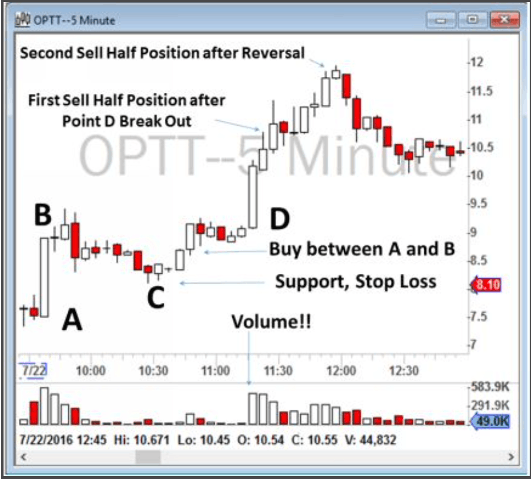
Now that we have a general idea of what an ABCD pattern looks like, how can you implement the ABCD pattern into your trading strategy? The answer to this question is relatively straightforward, if you are able to identify when a trend will change direction, you will be able to use that to your advantage by entering the appropriate positions prior to the reversal. That said, you will first need to be able to identify the pattern before you are able to trade it. To that end, let’s take a look at how you could identify the bearish ABCD pattern pictured above and how you would trade it.
As you can see in the chart above, the price initially begins to rise from what we consider the (A) to a further high (B). These two components form the basis of the first half of the bearish ABCD pattern. Once the price has reached (B), you should expect to see a fall back down to a support level (C). It is important to note, as you can see in the image above, that the support (C) should be higher than the initial point (A).
After the support level has been established at (C), you are almost ready to enter your short position. Once the price has spent some time around its support level, it should begin to rise up to a new high. This higher price represents the final component of the ABCD pattern (D). When the price has reached the final component of the pattern (D), you should enter your short position as the pattern has likely been confirmed and the price is likely to begin to fall. If the pattern holds true, the trend should reverse at (D) and your short position should become profitable.
Naturally, short positions carry considerably more risk than long positions do since the losses are theoretically limitless. As such, it is even more vital for new traders to place stop-loss orders and identify profit targets when entering these types of positions.
Generally, when trading an ABCD pattern, your profit target should be double the amount of risk you take on. This would mean that if you entered a $200 position with a stop-loss order at $180, your take-profit order should be at $240.
As we noted above, the ABCD pattern can indicate both bullish and bearish reversals. While we only covered a bearish reversal in this article, a bullish reversal is simply the opposite. As such, when attempting to trade a bullish ABCD pattern on an asset that has been trending downward, you should approach the trade in the opposite way.
As a final note, there are a number of indicators on charting platforms that can help you to locate ABCD patterns as they are forming. While it is beyond the scope of this article to recommend specific indicators, you should be aware that these indicators exist on most major charting platforms including TradingView, and can be especially useful in helping you to locate and trade these patterns.
Conclusion
It is commonly noted among members of the financial community that past performance is not indicative of future results. If you are actively trading in the financial markets, you would be wise to commit this phrase to memory.
Every trading strategy, no matter how sophisticated or how much previous success it has enjoyed, will inevitably fail at some point. No strategy can be expected to work indefinitely with every asset. As such, as a day trader, you should be able to adapt your strategy and trading approach to suit the current market conditions and price movements of the asset you are trading.
Lastly, regardless of which trading strategy you ultimately decide to employ, it is vital that you always remember to effectively manage your risk by setting stop-loss orders and allocating the appropriate level of capital to your positions. While it may seem like a simple rule, many traders regularly fail to perform these basic risk management tasks and pay the price for their negligence sooner or later. We hope that you enjoyed our beginner's guide to day trading. Thank you for reading!