

The dawn of the information age inarguably changed the world. The creation of the global network of computers that we call the internet came with an abundance of change and innovation that shaped the world we know today. Investing, like every other aspect of life, was forever changed by the internet. Among the changes that came to the financial landscape through the power of the internet was the development of charting software that could assist traders as they navigated their way through financial markets.
This article will provide you with the information you will need to both read and interpret the data on basic stock charts. To do this, we will use the TradingView platform as a demonstration tool while also providing you with an insight into steering your way through the Trading View platform.
Simply put, TradingView is a cloud-based charting and social networking platform designed for investors who intend to employ the use of technical analysis in their investment strategy. It offers both free and paid levels of service with Its free account offering basic charting and research tools.
At the time of writing, TradingView boasts a social network of over 30 million users. These 30 million users can employ TradingView software to inform their trading decisions whilst sharing their ideas with other users on the platform.
Further, users can not only share their charts with other traders but also view other traders’ charts and analyses. This can be especially useful for new investors who wish to gain an insight into the thought process of more experienced traders. Let’s briefly take a look at some of the advantages and disadvantages of the Trading View platform.
Pros
- Community - Trading is typically a solitary exercise. Very few traders have anyone at arm's length with whom they can share or discuss ideas. TradingView solves this problem by providing users with a platform to discuss their trades and strategies.
- Professional Development - Through the ability to interact with other traders, inexperienced traders will also be able to learn from what other traders are doing. By sharing their own ideas they will be able to learn from the feedback and criticisms they receive.
- Features - TradingView has a wealth of features available and its software and technology are second to none.
Cons
- Customer Service - Unfortunately, many users have reported delayed response times from TradingView’s customer service teams.
- Scams - Many unscrupulous users take advantage of the TradingView platform to promote their own penny stocks or cryptocurrencies in an effort to enrich themselves.
How to Read a Stock Chart
At first, analyzing a stock chart can be a daunting task as investors are bombarded with lines, colors, graphs, and numbers. However, once you have gotten a firm handle on the layout, reading stock charts can prove to be a very manageable task. To demonstrate this, we will read through the stock chart of one of the world’s most popular companies; Apple (AAPL).
You can find their stock chart taken directly from TradingView below. To access these stock charts, simply head to their website and select “Chart”. You can then load the chart of any asset you wish by searching for it using the search function on the top left-hand side of the screen.
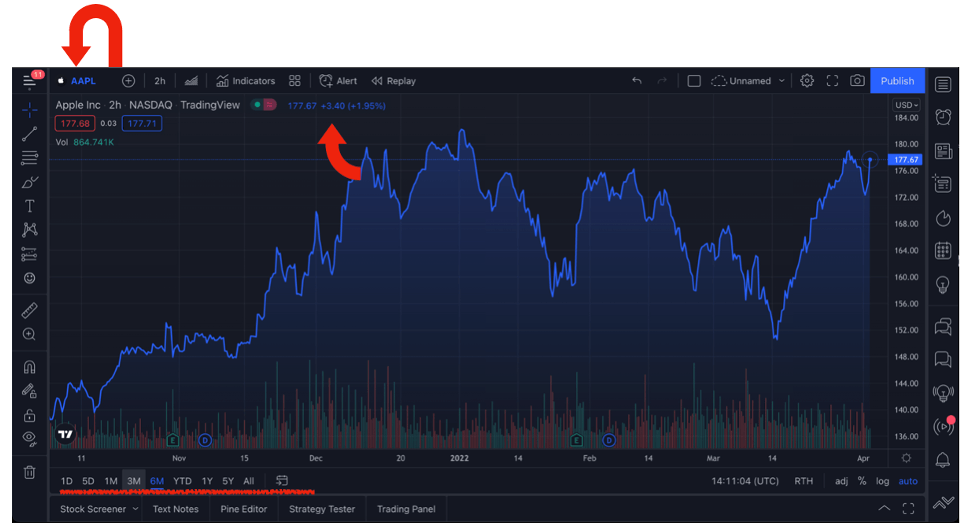
As you can see, the graph is reasonably easy to interpret as far as the basic stock information is concerned. Most users will be able to determine what they are looking at with reasonable speed. We can see Apple’s current stock price ($177.67 per share) as well as the movement of the day (1.95% up or $3.40).
Below the stock price, investors can see the various time frames that are available to view Apple’s price data. As you can see in the image above, we are currently viewing Apple’s chart over the previous three months.
Investors can examine Apple’s chart back to 1982 when the company first went public. The various options include 6 months, 1 year, 5 years, and YTD which stands for Year to Date (from January 1st of that year to the current date). Now that we have covered the basic stock price data, let’s take a more comprehensive look at how to set up a customized TradingView chart.
Trading View Layout
As you might imagine, every trader has their own specific preferences when it comes to their charts. Thankfully, TradingView provides traders with the opportunity to customize their charts. To accomplish this, all you need to do is right-click the chart and select “settings”. Once you have done this, the window pictured below should appear.
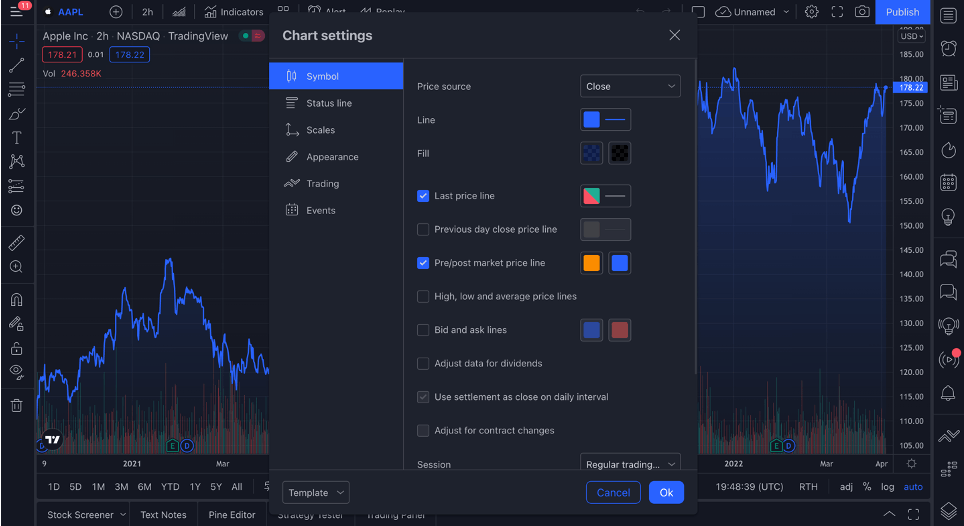
Through this functionality, you will be able to change the appearance and data displayed on your charts. This feature is especially useful as you can choose to display a great many data points on your customized chats including earnings, stock splits, dividend dates, or even economic events. Not every trader will need access to every one of these data points and so being able to customize your chart to your specific needs will be incredibly useful.
For example, if you are a trader looking to trade based on fundamental catalysts, it may be an idea to consider customizing your charts to display data points like earnings, dividends, or economic events.
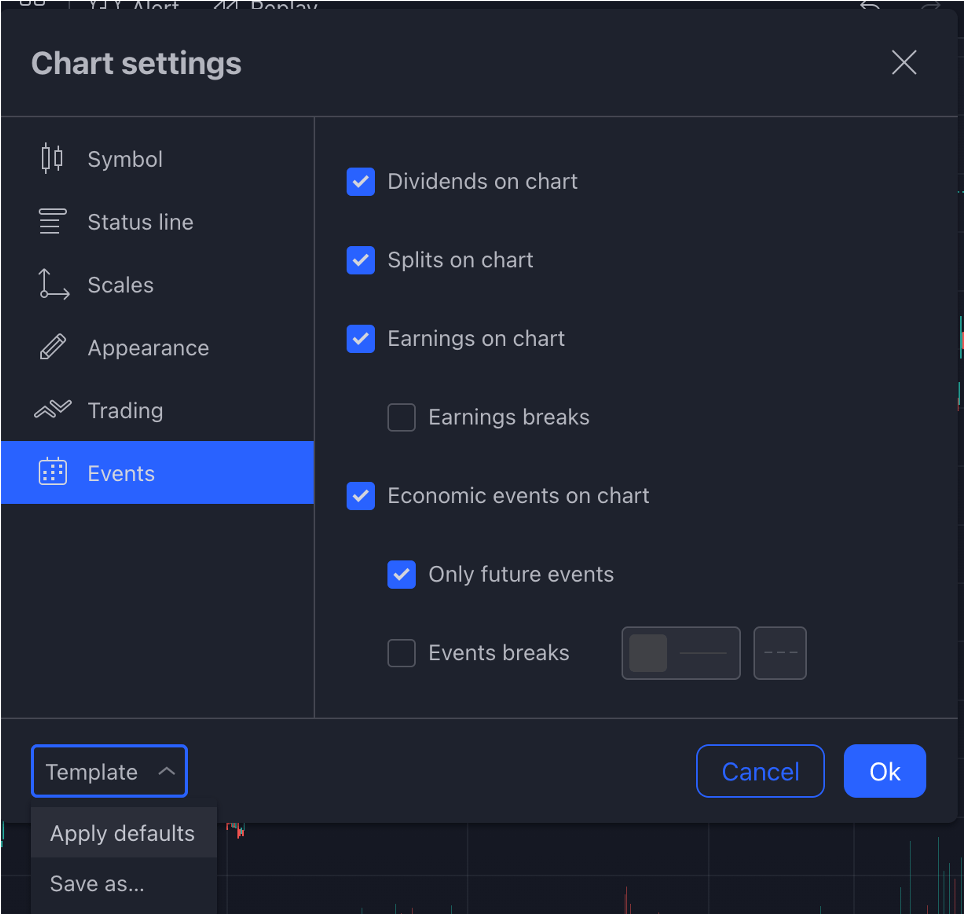
In the event that you make several changes to your chart settings but then wish to return to default settings, there is no need to manually unmake each of your changes. To return to default settings, select the “Template” functionality in the bottom left-hand corner of the chart settings window and then “Apply defaults”. Doing this will return your chart to its default settings.
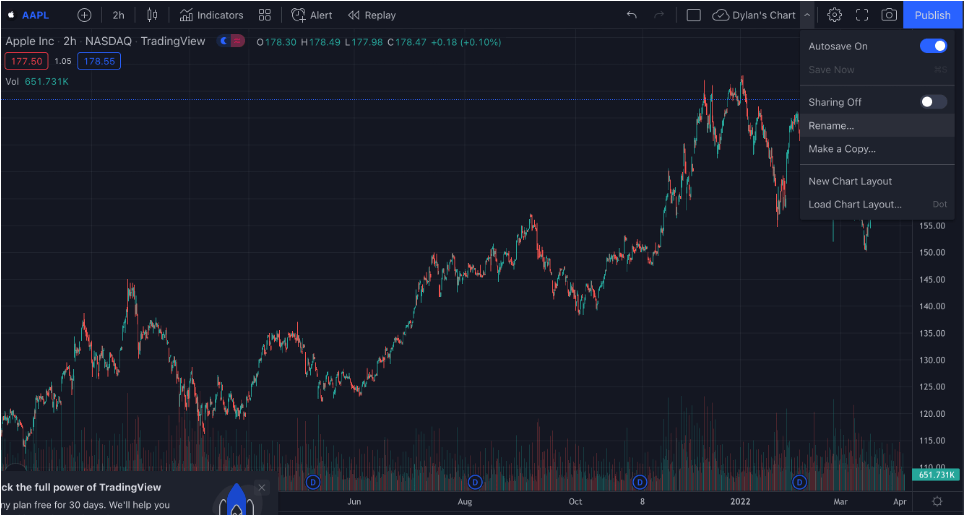
After you have decided on your customized chart settings, you can rename your chart and save it for future use. To do this, select the icon pictured in the image below and then select the option to “rename” your chart. You will see the name you select appear to the left of the icon as pictured below. You can now re-use this customized chart whenever you need to.
Drawing Tools & Alerts
Since there is far more to trading than simply customizing your chart setting preferences, let’s now look at how to make use of TradingView’s drawing tools and how to set up trading alerts.
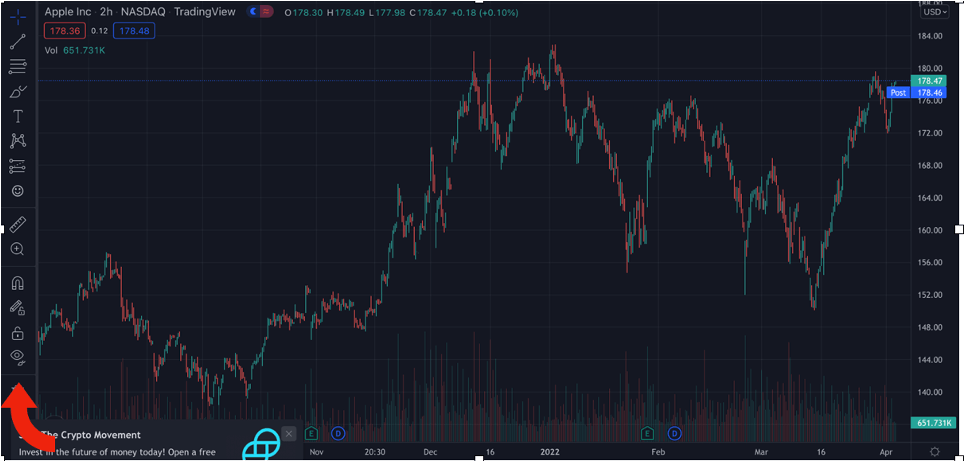
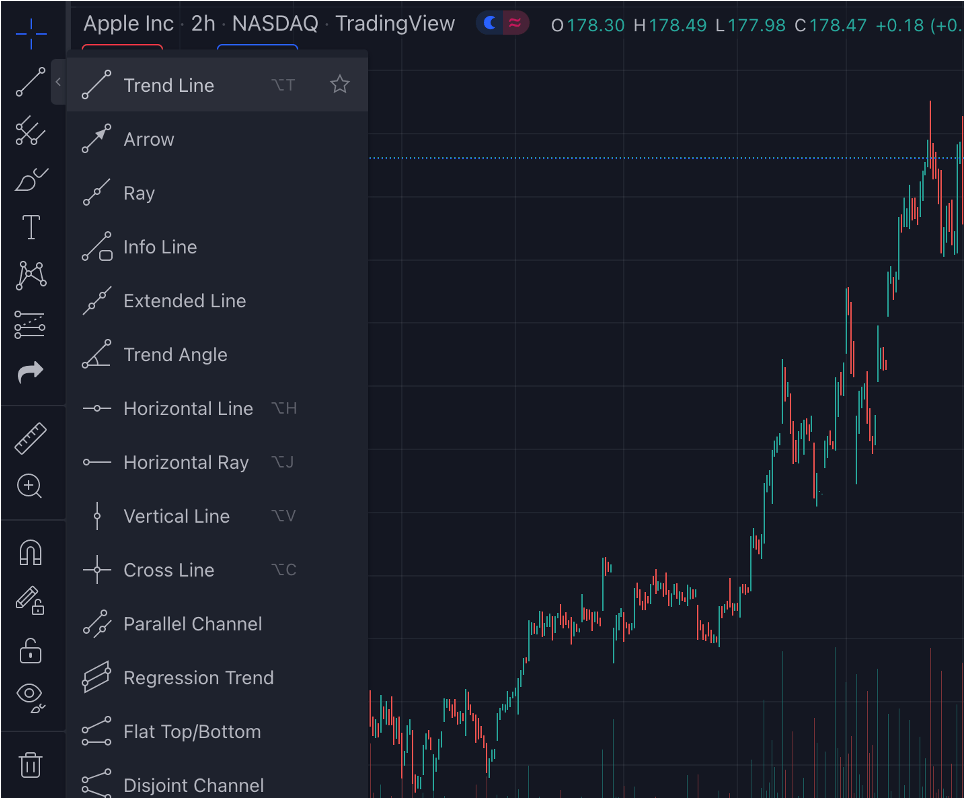
As is indicated in the image above, your drawing tools can all be found on the left-hand side of your screen when viewing a TradingView chart. Using these icons, you will be able to perform several different tasks that include drawing your trend lines, overlaying various patterns, writing text, and employing the use of various Fibonacci tools. For the purposes of this article, let’s take a look at how we might draw a trend line and place an alert for Apple (AAPL).
You can find your trend lines on the second icon’s drop-down list. Once you have selected it, you can draw your trend line directly onto the chart. Since there is far more to trading than simply customizing your chart setting preferences, let’s now look at how to make use of TradingView’s drawing tools and how to set up trading alerts.
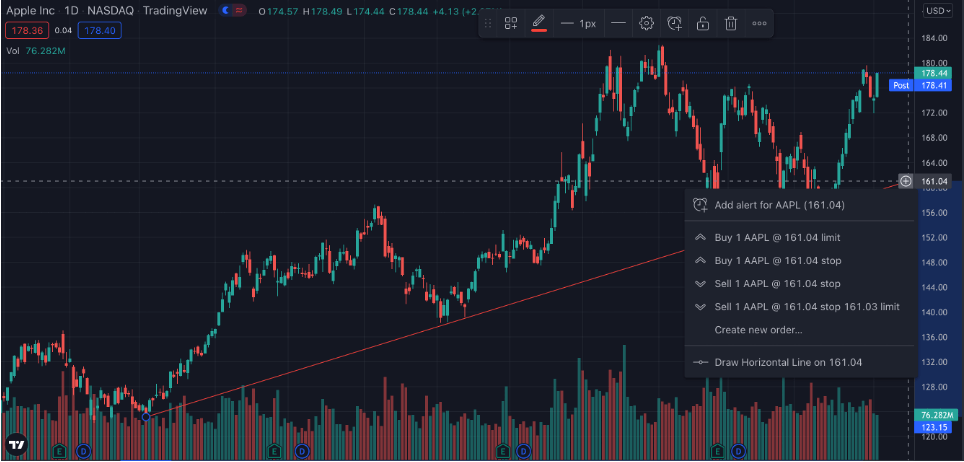
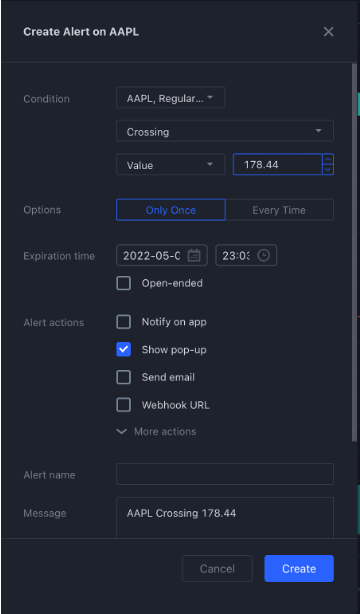
After drawing the trend line, you will notice that TradingView automatically presents you with the option to create an alert at the endpoint of your trend line. You can create alerts on TradingView through these automatic pop-up options or by right-clicking on the chart and selecting the create an alert option that is provided.
TradingView Indicators & Strategies
Indicators are some of the most important tools every trader needs in his toolbox. In this section, we will first examine what indicators are and then how to use indicators on TradingView. So, what is an indicator?
A technical indicator is a mathematical calculation that uses metrics such as historical price data, volume, and open interest to forecast the direction of a specific market or asset. Simply put, you can use indicators to help you determine which direction the price of a specific asset is likely to move in. Now, let’s explore how we can use these indicators on TradingView.

As you can see above, indicators can be accessed on the TradingView platform by selecting the indicator function at the top of the screen. Once you have selected the option, you will be presented with a pop-up menu that lists a wide variety of indicators.
For those of you who are unaware, there are hundreds of different kinds of indicators for you to choose from. It is unlikely that most of you reading this will ever need to utilize hundreds of different indicators and so you must know which specific indicator you are looking for.
It should be noted that TradingView has two different types of indicators available; default and community. Default indicators are the ones that are created by TradingView whilst community indicators are those that have been developed by other traders and published on the TradingView platform.
Further, TradingView also provides you with the opportunity to script your indicators and add them to TradingView. Although this is a highly advanced task, it can be very useful in specific situations and allows you greater flexibility in developing your unique trading strategies. For the purposes of our example, let’s look at how to overlay a simple support and resistance indicator onto our chart.
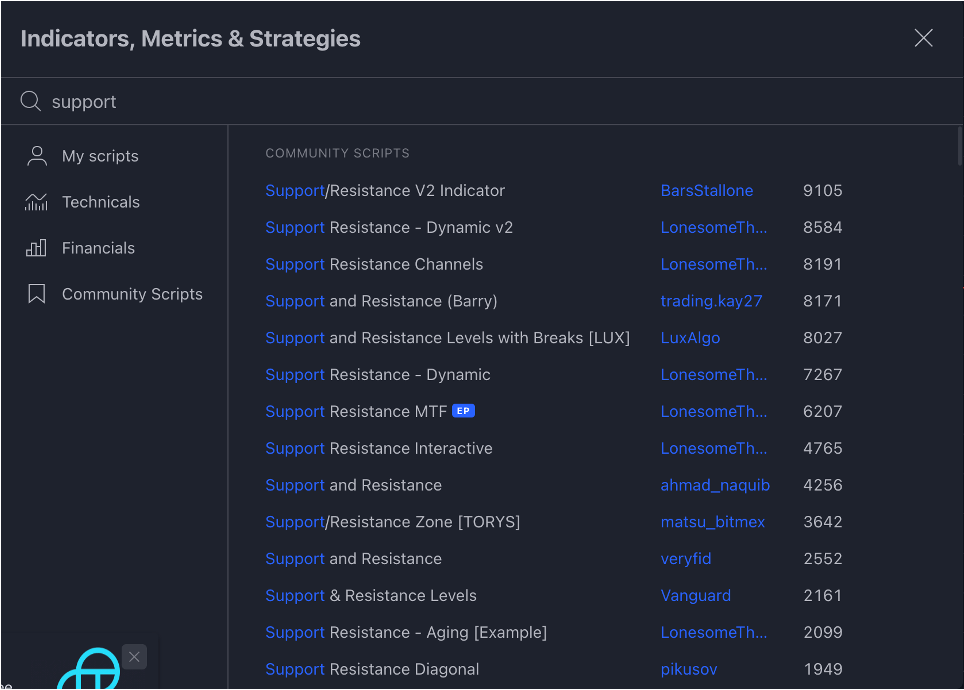
The above image demonstrates the vast number of indicators that are available. Even when searching for a simple support and resistance indicator, there are dozens of options. As such, it is vital that you research the specific indicator you will be using in order to identify the correct indicator from this list.
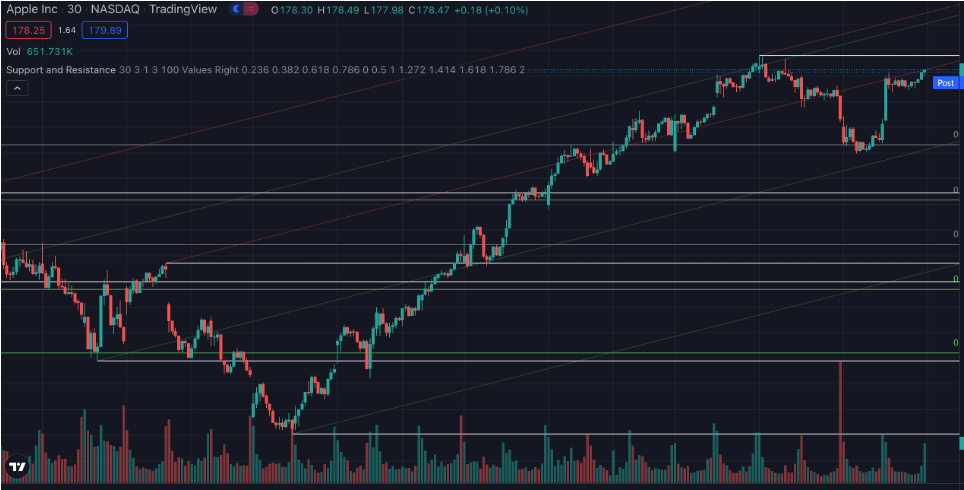
After you have selected your indicator, you will notice that they overlay directly onto the chart automatically as you can see above. If you wish to remove this indicator and replace it with another, you only need to select one of the lines on the chart and delete it.
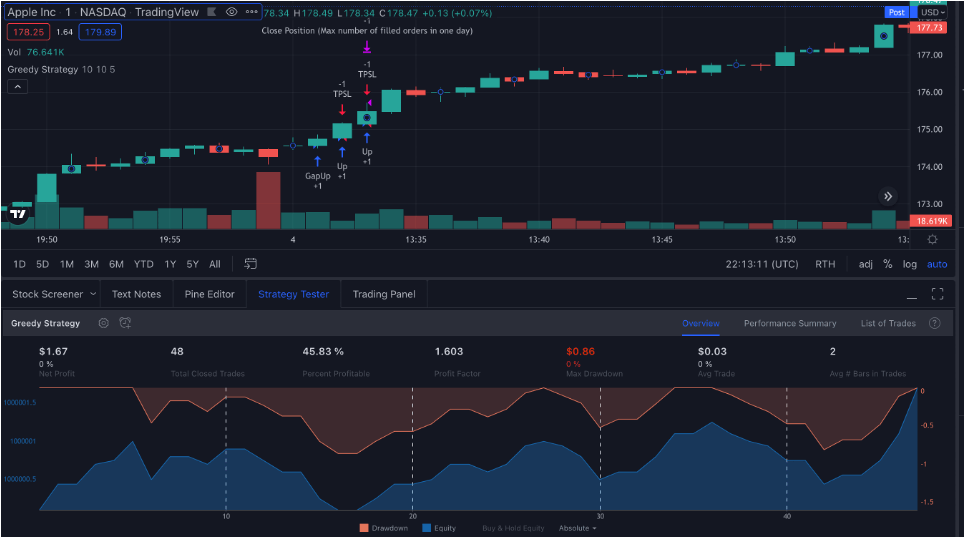
Beyond the overlaying of specific indicators, TradingView also allows you to add specific strategies to your chart. One particularly popular strategy, especially among new traders, is known as the Greedy Strategy.
For those of you who are unaware, the Greedy Strategy is designed to capitalize on gaps in either direction of the market. The trader opens an initial order if there is a gap between the current open and the high or low of the previous bar. Assuming that the open is greater than the previous high, you would enter a long position. If the open is below the low of the previous bar, you would go short.
After you have opened a position, you would continue to fill orders that are in the same direction for as long as the color of the candle is consistent with the open position. This will continue until either a different color candle presents itself or the trader reaches their limit of filled orders for the day.
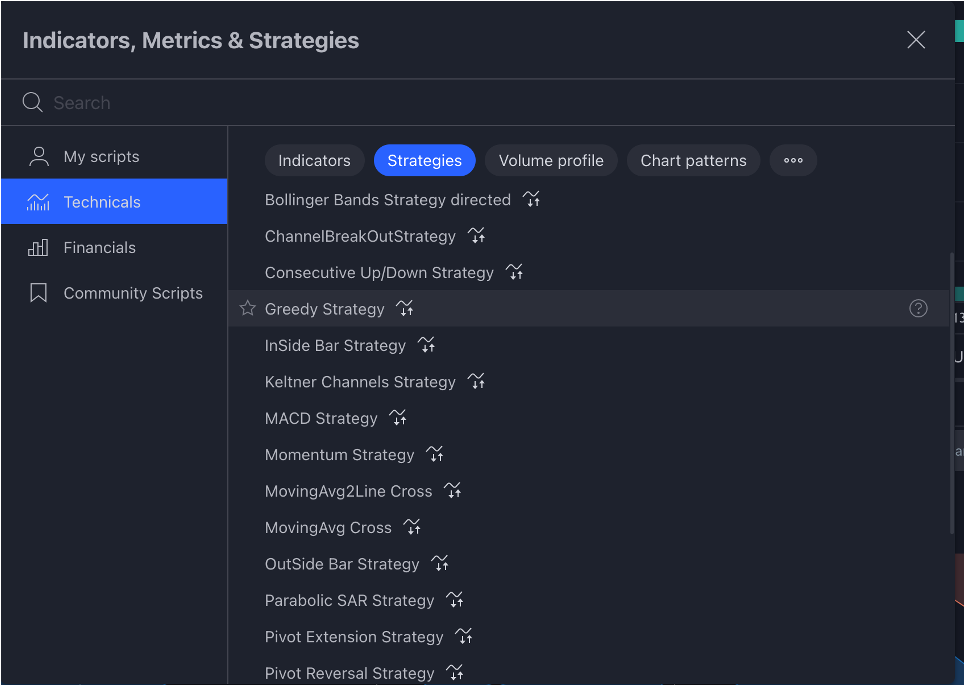
If you wanted to implement the Greedy Strategy into your own trading strategy, you could do this directly on TradingView. As you can see below, the Greedy Strategy is available on TradingView and can be overlayed directly into your chart.
Economic Calendars
Next, we have TradingView's economic calendars. Economic calendars can help us keep track of the specific occasions where relevant market information is released. As such, they are particularly important tools for traders and it is important to know how to make use of them on TradingView.
The option to select your economic calendar can be found on the right-hand side of your screen as indicated in the image above. These calendars are capable of tracking the economic data releases of a large number of countries so you will need to select the specific country you wish to keep track of. For our example, we have selected the United States.
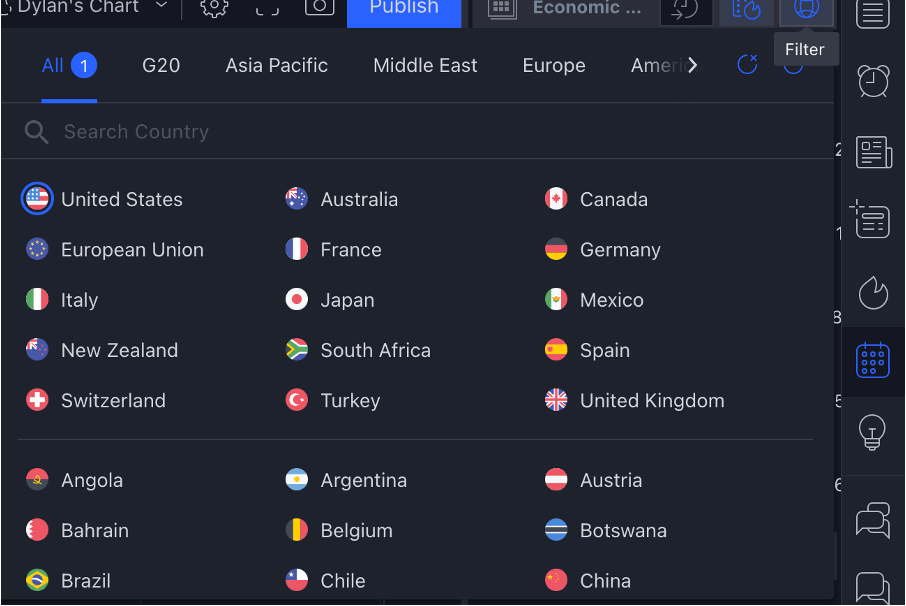
After selecting the country you wish to be informed of, all the relevant economic data releases will appear in a dropdown menu. If you are unsure what a particular release is referring to, you can select it to find more information about the event. For example, if you had been unsure about what the Fed Bullard Speech was about, you would have been able to read further about this particular event.
Paper Trading
Lastly, we have TradingView’s paper trading feature. Make no mistake, trading in the financial markets is a high-risk activity. As such, it would be prudent to test and develop your skills on a paper trading account before putting any real capital at risk. Paper trading accounts like these afford inexperienced traders the opportunity to practice trading in a simulated environment that mimics real market activity. With a paper trading feature, you are able to practice trading without risking any real money. Let’s look at how we can use this feature on the TradingView platform.
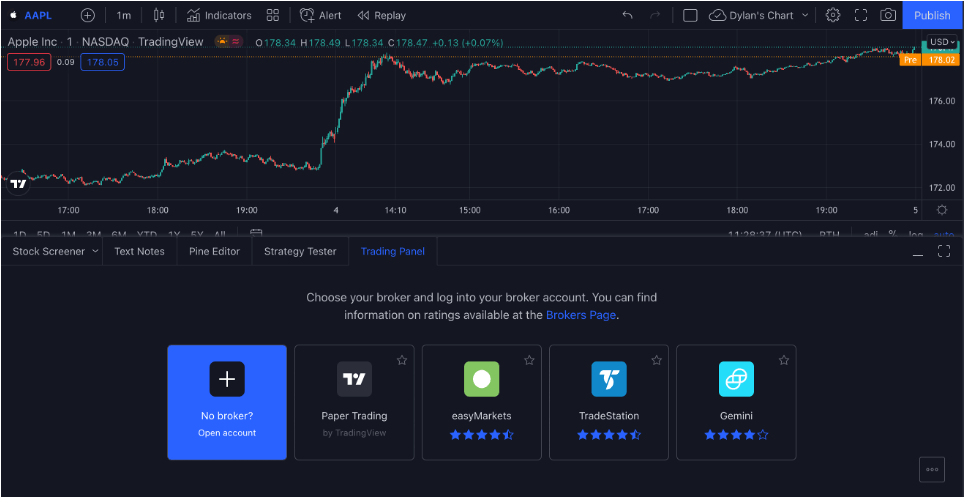
To open your paper trading account, select the “Trading Panel” at the bottom center of your screen. This will open up the menu for connecting the various brokerages that TradingView supports. After you have opened up your trading panel, open a paper trading account.
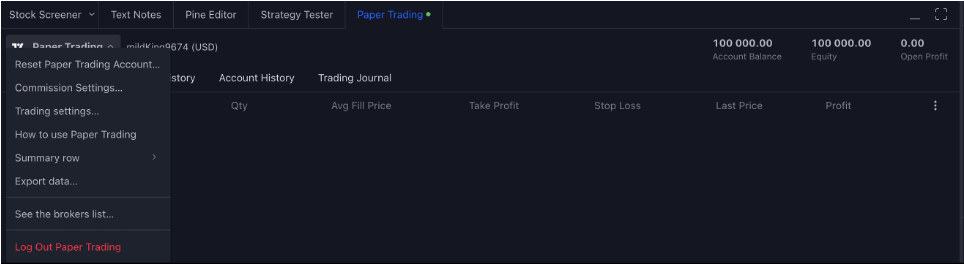
To log out or swap onto another account, simply select the account and log out as seen in the image below.
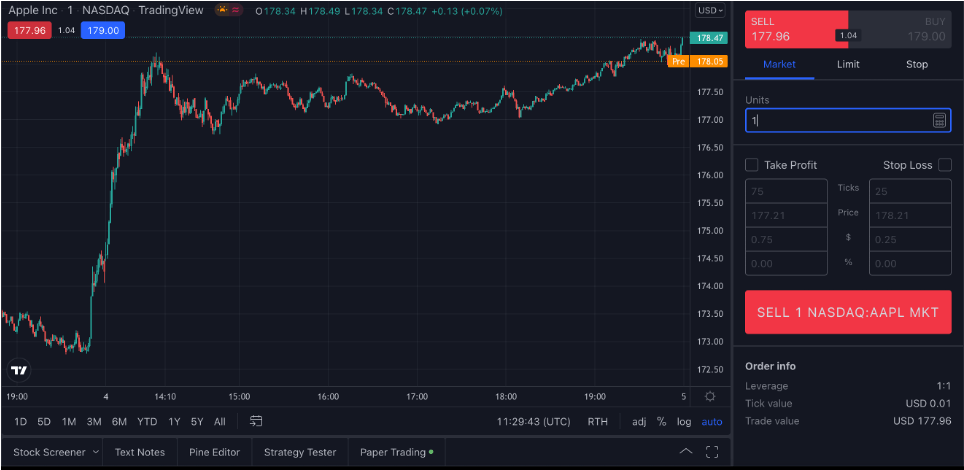
Now that you have access to your paper trading account, you are able to begin practicing your skills. As you can see in the image above, the paper trading account provides you with $100,000 of capital to practice with.
To begin opening and closing positions, all you need to do is select the buy and sell functions on the top left-hand side of the screen. Selecting either of these will open the trade window you can see on the right-hand side of the screen below.
Conclusion
Whether you are keen to learn about day trading or are just interested in knowing what is occurring in the financial markets, charting software like the one created by TradingView can be an excellent resource for investors of every level. However, no amount of sophisticated tools or resources will make up for an individual trader's skill. If you wish to have a successful career in the financial markets it will require many hours of study and practice to master not only the tools of the trade but the knowledge and experience that is required to succeed.