In trading, a candlestick refers to a particular price chart that provides traders with specific information about the price of that security over a given period. Occasionally, these candlesticks arrange themselves into identifiable patterns. These patterns, when interpreted correctly, can assist traders in lowering their risk, confirming trends, and making informed trading decisions.
Further, because trading is such a high-risk activity, we will cover four simple "trading rules" that every trader should follow to ensure they mitigate any potential losses and maximize their returns. Let's get started!
Trading Rules
When in Doubt, Get Out!
Trading is far from an exact science. While charts, trading patterns, and indicators can provide you with a statistical advantage when making your investment decisions, they are not a guarantee.
Unfortunately, some trades, however well setup they make look, will simply not work out. In practice, as many as 40% of your trades may fail. For this reason, it is best to make your mistakes quickly. If you enter a trade and that trade is giving you reasons to doubt its ability to perform, close your position quickly.
Never Look Back
Admitting we made a mistake and closing a position at a loss can be a psychologically painful thing to do. Due to this psychological discomfort, many traders hold onto positions for longer than they should. They think that they should have closed the position at a previous point and did not, so they decide to wait for the price to return to its previous level before closing the position. This is a horrible mistake to make.
Once you realize that you were wrong about a trade, take the loss and do not look back. Similarly, if you close that trade and the price skyrockets after, do not look back. A trader must make decisions based on the information they have at the time. It is relatively easy to look back at a former trade and determine how you could have executed it better; this is a waste of time. Make your decisions based on your available information and do not look back.
Prior Planning Prevents Poor Performance
Trading requires that you spend a sufficient amount of time analyzing potential trades and planning them accordingly following trading patterns. Do not attempt to trade by "shooting from the hip" and making it up as you go along. This is a guaranteed method of losing money over time. If you cannot find high probability trades the evening before a trading day, sit back and wait for the following day. It is better to miss potential profits than to make up for losses.
Ignore the Noise
If you trade based on candlesticks, do not let the news influence your decisions. Unless it is a news item that is a total shock and surprise to the rest of the world, it should not influence your trading decisions. To give you an example, the Russian invasion of Ukraine would be a shocking news story that should influence your trading decisions. However, commentary made by a Government official about a barely relevant topic should not impact your trading decisions.
Candlestick Patterns
These candlesticks patterns apply to any tradable asset with publicly available historical price data - which includes forex and cryptocurrencies, and can be applied to any timeframe.
Dark Cloud Cover
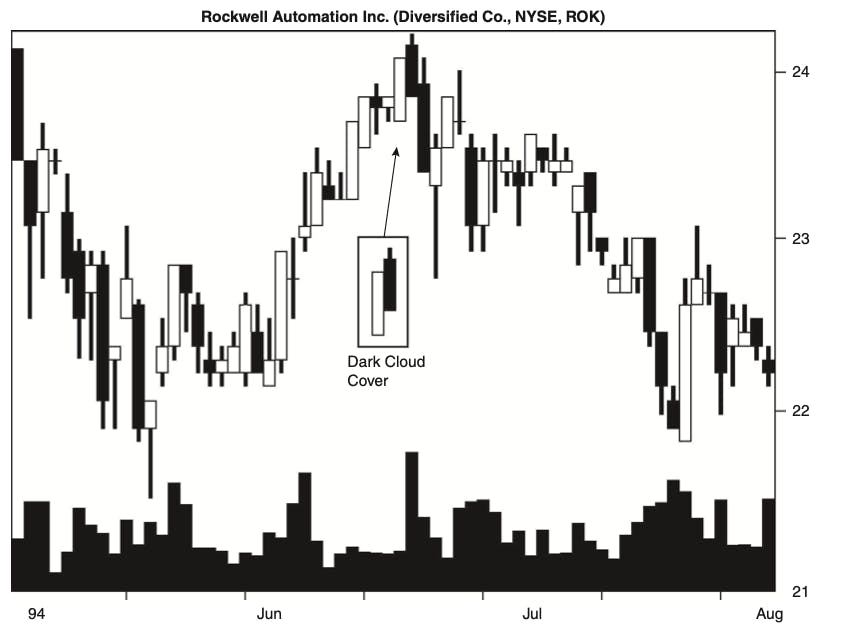
As you can see in the image above, the Dark Cloud Cover pattern somewhat ironically begins with an upward price trend as bulls force the price of the security higher. You should be able to locate a tall white candle that suggests additional returns followed by an open the following day higher than the previous day's high. At this point, bearish traders should begin to apply selling pressure that pushes the price to close in proximity to the day's low, thereby completing the candlestick pattern.
Most traders only consider this particular candlestick pattern useful if it occurs following an uptrend. As prices continue to rise, the pattern becomes more useful in identifying a reversal in that upward trend. If the price action on a security of rather mixed or trading sideways, the Dark Cloud Cover pattern is significantly less reliable.
To summarise, when identifying a Dark Cloud Cover Pattern, you should look for the following five criteria:
- An existing bullish uptrend;
- A bullish candle within the uptrend;
- A gap up the following day;
- The gap up turns into a bearish candle;
- The bearish candle closes below the midpoint of the previous bullish candle.
The Dark Cloud Cover pattern indicates that the price of the security is likely to decline. Therefore, if the price of that security continues to rise the following day, it may be reasonable to conclude that the pattern has failed. However, if the price does indeed decline the following day, you can conclude that the pattern has been confirmed and it's safe to enter the trade.
Naturally, traders who identify a Dark Cloud Cover pattern would be well advised to exit any long positions. For traders seeking to enter short positions, it is considered best practice to place a stop-loss order above the high of the confirming bearish candle. The confirming bearish candle will be the candle that confirms the Dark Cloud Cover pattern the following day.
A Dark Cloud Cover pattern should be utilized in conjunction with other technical indicators to ensure the highest statistical probability of success. Many traders implement an RSI indicator when attempting to trade this particular pattern. If the RSI had a reading above 70, this indicates that the security is overbought. As such, an RSI reading above 70 combined with a Dark Cloud Cover pattern is a more reliable indication that the price of the security is likely to fall.
Unlike other candlestick patterns, Dark Cloud Cover has no natural profit-taking target, and traders must determine when to take profits using other indicators such as RSI, moving averages, or fundamental factors.
Gravestone Doji
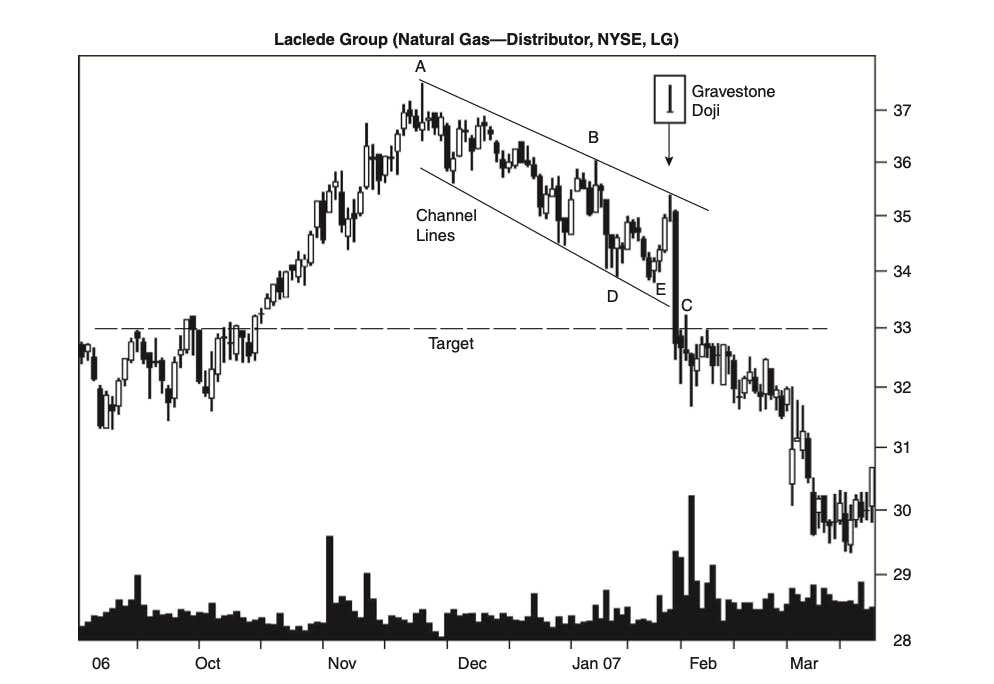
The aptly named Doji Gravestone pattern is a bearish reversal pattern. This means that it signals the price of the security is about to fall. While it is more common to identify Gravestones in up trending securities, as we can see in the image above, Gravestones can also be found in down-trending securities indicating that the price will continue to fall further.
A Gravestone is created when the open and close are equal to the low of the day. This occurs in circumstances where bullish traders dominate activity early on, driving the asset price higher. The rising price then attracts bearish traders who eventually overwhelm bulls with selling pressure leading to a close down at the opening price, which is also the low of the day. In other words, the Gravestone is formed when the price opens positively but ends the day where it started after falling back down.
Since Gravestones indicate the price of a security is about to fall, traders will typically exit long positions and enter short ones. As always, you should attempt to confirm candlestick chart patterns with other indicators. When it comes to Gravestones, volume is a key metric to keep an eye on.
As you can see in the chart above, volume spiked shortly after the Gravestone was formed. This spike in volume indicated the oncoming selling pressure that ultimately led to the price of that security falling. Individuals who had been trading the setup above would have been well-advised to enter a short position once the Gravestone was formed. Conversely, it is considered best practice to set your stop-loss orders slightly above the low of the previous day.
It is difficult to determine a fixed formula for profit targets on Gravestones. Instead, traders must use their intuition and other indicators to determine when the fall in price may end and when they should take profits.
Similarly, the Gravestone Doji is not a particularly reliable candlestick pattern. For this reason, it is recommended that the pattern be accompanied by other confirming indicators such as volume, RSI, or the MACD.
Dragonfly Doji
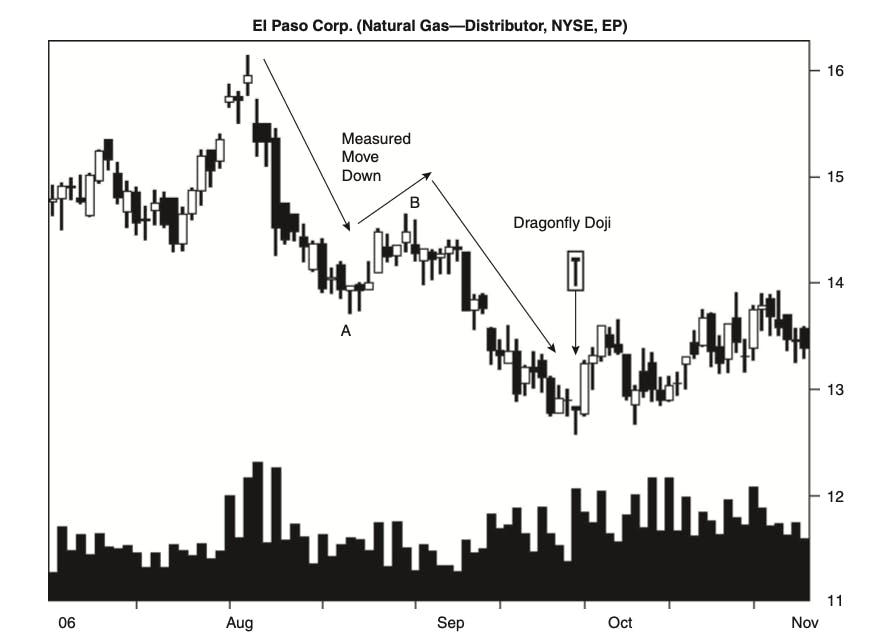
The Dragonfly Doji is the polar opposite of a Gravestone. However, much like a Gravestone, in order for a Dragonfly to be formed, the price of the security must open and close at the same level.
Identifying a Dragonfly is relatively straightforward due to the uniqueness of the pattern. It is formed on trading days where, at the open, bearish traders force the security price lower as they apply more and more selling pressure. At some point throughout the day, bullish traders will pounce on the opportunity to pick up shares at a discount and begin to drive the price of the security back up before it ultimately closes at the same level it started. If you recall the Gravestone formation above, you will note that the formation of a Dragonfly pattern is the exact opposite of a Gravestone formation.
Unfortunately, the Dragonfly Doji suffers the same limitations as the Gravestone and all other Doji formations in that it is not an especially reliable candlestick pattern. Once again, it is recommended that the pattern be accompanied by other confirming indicators such as volume, RSI, or the MACD.
Similarly, Dojis have little forecasting ability if they are trading within a range. This is because for Dojis to be effective, they require a trend to reverse. Since a security trading within a range does not have a trend to reverse, the Doji is effectively useless. The only exception would be if the price of the asset is at the top or bottom of a range. In this situation, the Doji may be useful in helping to confirm support or resistance lines.
For example, a range-bound asset trading near a support line may form a Dragonfly Doji. This would indicate that the security is likely to increase in price and would help to confirm the reliability of the previously established support line.
Morning Star
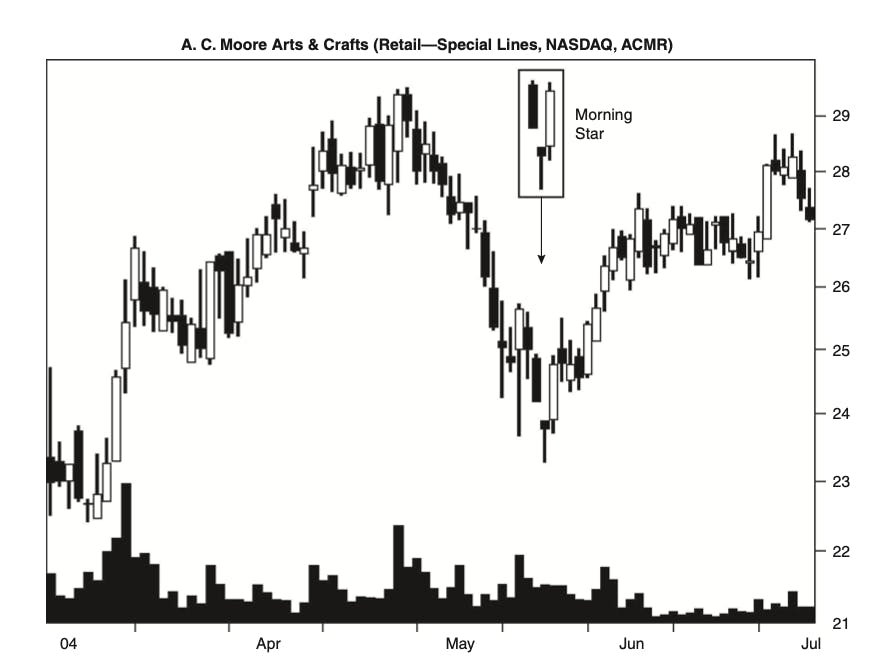
The Morning Star is a bottom reversal pattern. This means that it indicates the price of a security will be moving higher after the downtrend it has been on is reversed. Its name is derived from the nickname for the planet Mercury which is said to foretell the sunrise.
As you can see above, the pattern is comprised of three distinct candles. The first is a full black candle which demonstrates that bearish traders are in full control. The second candle is a smaller black candle which highlights the fact that bearish traders are losing control of their ability to drive the price of an asset downward. The final candle of the Morning Star formation is a full white candle that takes back a lot of the price action the first candle in the formation took away. You can see each one of these candles highlighted in the image above.
The ideal Morning Star should also have a gap between the second and third candles. However, the lack of a gap does not necessarily weaken the validity of this formation. The main factor in identifying a Morning Star formation is that the third candle should make a significant move up, making up for most of the losses caused by the first black candle.
Like every candlestick pattern, the Morning Star is not without its limitations. One of the main limitations of this pattern is that traders must wait for the third candle to close to complete the pattern. Typically, by the time the third candle closes, the price will have already experienced a meaningful rise. This presents problems for traders in the context of risk/reward. A large part of your potential reward will already be gone by the time the third candle closes.
As you might imagine, since a Morning Star formation indicates the price of a security will rise, traders would be well-advised to exit their short positions and open long positions. When doing so, placing a stop-loss at the bottom of the second Morning Star candle would be the best option.
Before opening positions, it is always best practice to try and confirm the price reversal using other indicators. Since the Morning Star pattern is bullish, support lines will be especially useful when trying to confirm the pattern. Similarly, traders who have positions in this pattern would ideally like to see volume increasing throughout the three candlesticks, with the third day experiencing the most volume. High volume on the date of the third candle is seen as the most reliable form of confirmation of a Morning Star pattern.
Evening Star
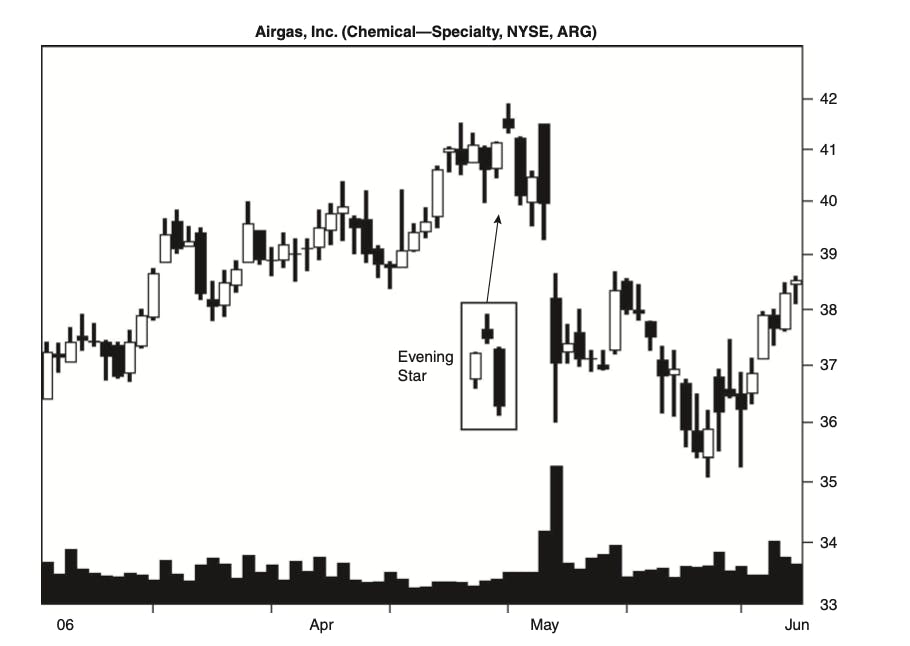
As you might have already guessed looking at the chart above, the Evening Star formation is the bearish cousin of a Morning Star. Like the Morning Star, the Evening Star's name is derived from the planet Venus, which appears just before the sun goes down.
The Evening Star formation is also composed of three distinct candles. The first candle is a long white candle that is preceded by a short black candle. This short black candle is the star and signals traders that a top has been reached. The Evening Star formation is complete when the third candle is black and re-takes a lot of the gains earned by the first candle. As you have likely noticed, the formation of the Evening Star pattern is simply the inverse of the Morning Star.
Ideally, the Evening Star will also have a gap between the second and third candles. However, this gap is even rarer in Evening Stars and is not entirely necessary for the success of the pattern. While many educational charts will display both Star patterns with a gap, in practice, you may not be able to witness these gaps forming in your patterns. The main identifier of a successful Evening Star pattern will be the amount of ground re-taken by the third candle from the first.
The limitations of the Evening Star are identical to those of the Morning Star. Much of the risk/reward offered by the Evening Star will be gone by the time the pattern has been confirmed by the third candle.
Since the Evening Star pattern is a bearish pattern, resistance lines will be very useful in confirming the pattern. Like the Morning Star, traders would also ideally like to see volume increasing over the course of the three candlesticks, with the third day seeing the most volume. High volume on the date of the third candle is seen as the most reliable form of confirmation of an Evening Star pattern.
Shooting Star
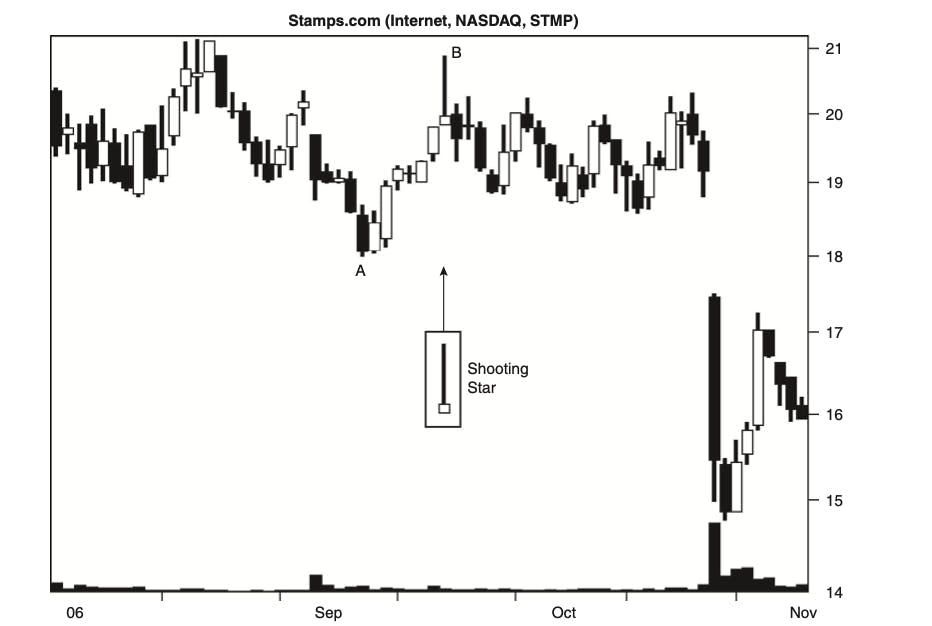
The Shooting Star pattern is a bearish candlestick pattern that appears after an uptrend. As you can see in the image above, the Shooting Star has a long upper shadow (or wick), minimal lower shadow (if any), and a small body. The Shooting Star is named for an old Japanese proverb that says "a shooting star shows trouble overhead."
As the Shooting Star is a bearish pattern, it must follow a rally or uptrend in the price of a security. The pattern will be most effective when it has formed after a series of three or more consecutive bullish candles, each reaching higher and higher highs. That said, it may also appear after a series of bearish candles provided that the overall price of the security has been rising during the given period.
The Shooting Star should begin with a positive move at the open that is ultimately erased by bearish selling pressure driving the price back down to its open price, thereby creating the Shooting Star candle. The long upper shadow of the candle is representative of all the bullish traders that are now losing on their trades as the price has fallen.
The perfect Shooting Star will have a real body that gaps away from the prior real body. You can see this gap between the two candlesticks in the image above. As with other chart patterns, this gap is not entirely necessary to the success of the formation, and in practice, you may not be able to see a gap form between the candles. However, the lack of a gap on a Shooting Star pattern may be a reason to doubt the reliability of the pattern if other indicators are also not supporting it.
If you recall the Gravestone pattern we discussed earlier, you may notice that the Shooting Star somewhat resembles this pattern. This is because a Gravestone Doji is a particular kind of Shooting Star. While the Shooting Star has a very small body, the Gravestone has no candle body at all (no Doji's have a body). This makes the Gravestone Doji a much more bearish pattern when compared to a Shooting Star.
The problem with a Shooting Star pattern is that they are not especially bearish and can only present themselves after meaningful rallies or uptrends. Therein lies their most significant limitation. During a major uptrend, the significance of a single candle should not be overstated. Therefore, you will need to wait for the price to begin to fall to confirm the reliability of the Shooting Star.
Unfortunately, since the Shooting Star is not particularly bearish, there is no guarantee that the price will fall by any meaningful amount. After a short decline in price, the security may recover and continue upward in price.
As a result, by the time the Shooting Star pattern is confirmed, it may already be too late to trade. Therefore, traders attempting to trade a Shooting Star should attempt to utilize other indicators to determine how bearish the specific shooting star may potentially be. Indicators that would be useful in trying to gauge how far the price of a security will fall after a Shooting Star include RSI, resistance lines, moving averages, and volume.
Before continuing to the following pattern, we should note that a Shooting Star looks almost identical to another pattern known as an Inverted Hammer. The only difference between the two patterns is that the Shooting Star comes after a notable rise in price, whereas the Inverted Hammer is typically formed after a significant decline.
Hammer
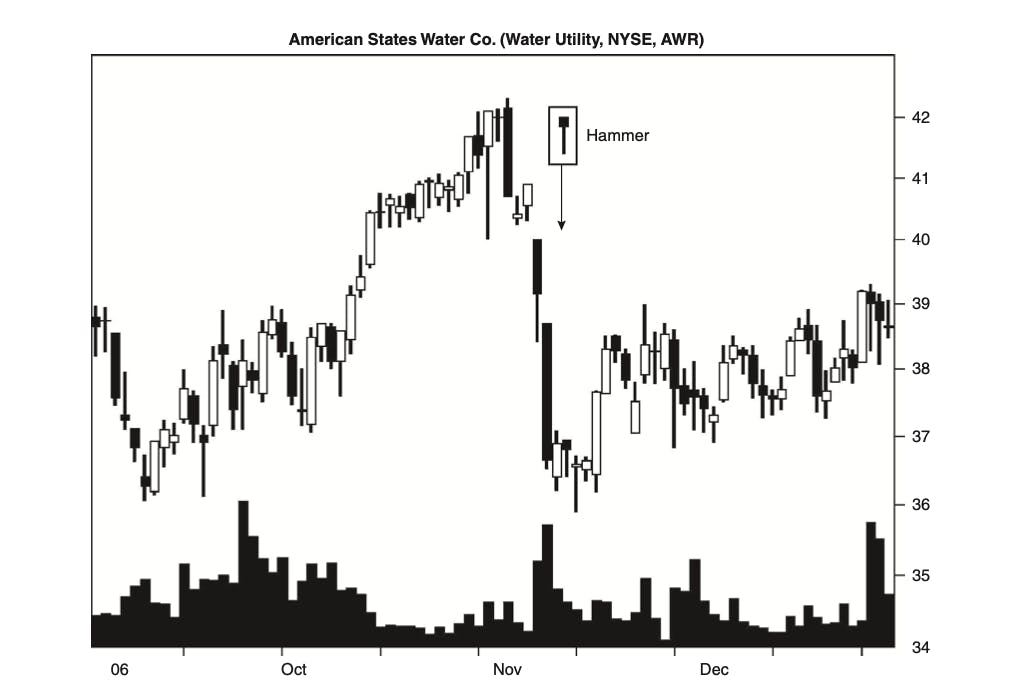
As you can see, the Hammer formation consists of a small body followed by a long shadow. While the Hammer pattern is a bullish reversal pattern, the body of the Hammer can either be bullish or bearish. This is because even a bearish body can lead to a strong increase in price.
However, for the general reader, we can assume that a bullish body leads to a more bullish reversal, whereas a bearish body leads to a less bullish reversal. That said, in my personal experience, the color of the body has not had any impact on the success of the Hammer formation.
The key criteria to identify a Hammer pattern will be the length of the shadow. The shadow, or wick, should be at least two or three times longer than the length of the body to qualify as a Hammer pattern. Let's take a look at what this looks like in practice.
As you can see in the image above, two potential Hammer patterns are forming. However, the first Hammer pattern has too short a shadow to meet the requirements of a Hammer. As such, the first candle is not a Hammer pattern. You can see that the second candle has an especially long shadow that is well over the required two or three times the length of the body. This length is what validates the pattern.
The length of the candle is important because it demonstrates that the market has attempted to move down the price of the asset but failed. Buying pressure has pushed back the price of the asset to the body of the Hammer. The Japanese refer to this as a bullish "Kamikaze fight." The failure of the market to move the price of the asset down even further is what indicates that a reversal may be imminent.
The reversal (and the Hammer itself) is confirmed the following day, provided that the market continues moving up. If this is the case, then the Hammer pattern is confirmed, and traders can enter their trades accordingly.
However, if the market begins to trend downward again, you should remember rules #1 and #2 and either refrain from entering positions or take your losses quickly and close your positions. Remember, it is better to miss out on some profits than to make up for your losses.
Much like the Shooting Star pattern, it should also be noted that the Hammer has a near-identical pattern called the Hanging Man. The only difference between these two patterns is that where the Hammer is a bullish pattern that appears at the end of a downtrend, the Hanging Man is a bearish pattern and appears at the end of an uptrend.
Bearish Harami
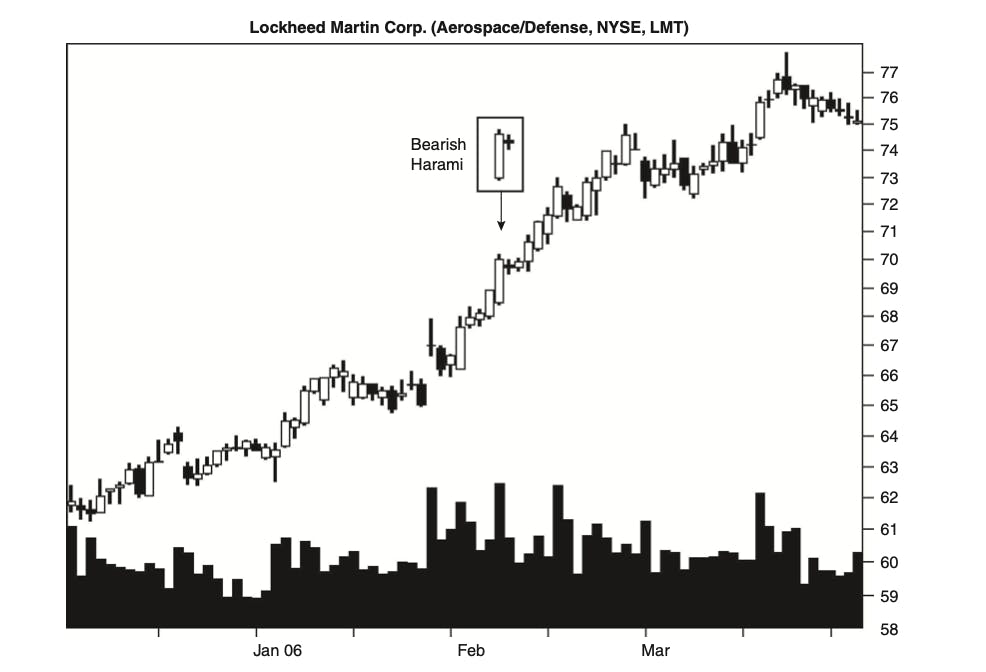
The Bearish Harami Pattern is a two-stick pattern that indicates the price of a security will soon inflect to the downside. However, as the chart above clearly shows, the Bearish Harami is not infallible and can fail.
The image above shows a perfectly formed Bearish Harami that failed to reverse the trend as the price continued to climb higher. It should be noted early on that the Bearish Harami is an especially unreliable pattern and is known to fail regularly. For this reason, traders should exercise extra caution when deciding to open positions based on a Bearish Harami pattern.
Identifying a Bearish Harami pattern is fairly straightforward. It consists of a long white candle which is immediately followed by a small black candle. The only requirement for the Bearish Harami is that the small black candle must be smaller and contained within the body of the primary candle.
The potency of the reversal is directly correlated to the size of the secondary candlestick. The smaller the candlestick, the more likely the chance of reversal. It should be stressed that regardless of how small that secondary candle is, the pattern always retains a chance of failure. As you can see in the example above, the secondary candle was significantly smaller than the primary candle, and the trend still failed to reverse.
Since the Bearish Harami is notoriously unreliable, traders typically combine this pattern with several different trading indicators. While there are many different indicators that you could apply, the 200-day moving average is especially popular when trading a Bearish Harami pattern. However, you can also make use of RSI indicators as well as a scholastic oscillator when attempting to verify this candlestick formation.
Although stop-loss orders are always advised, when trading this particular pattern, it should be emphasized that a stop-loss is necessary. The stop-loss order location will depend on your level of risk appetite. Traders with a low level of risk tolerance would be well-advised to place a stop-loss order at the bottom of the secondary candle after the price has inflected to the downside. Traders who prefer a more risk-on approach would likely decide to place their stop-loss orders at the top of the primary candle.
Bullish Harami
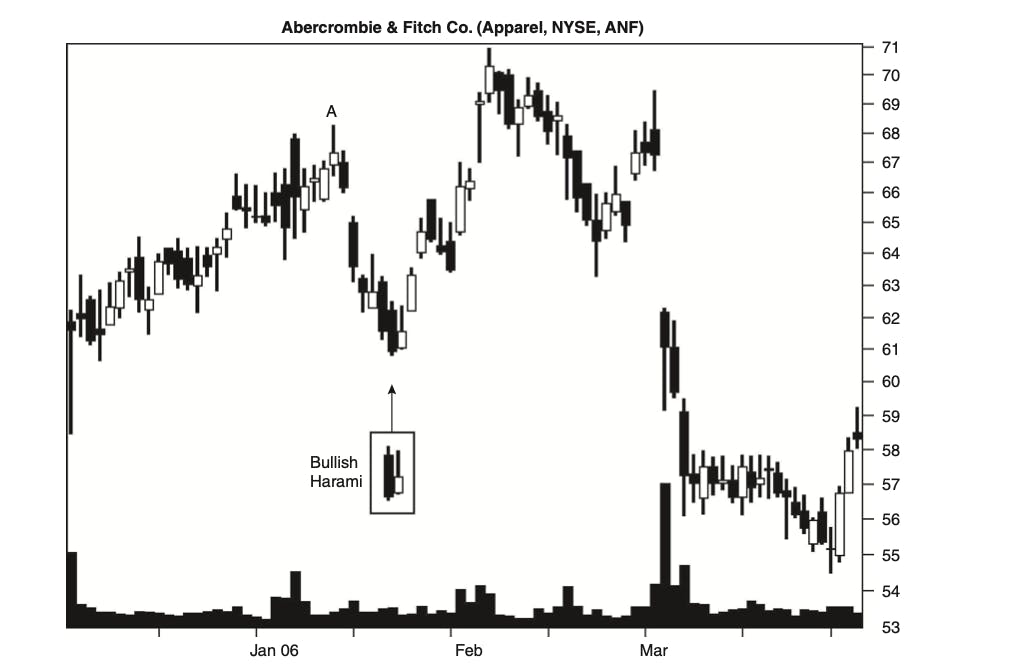
The Bullish Harami is the bullish counterpart to the Bearish Harami and indicates that a downtrend will soon reverse. Like the Bearish Harami, the Bullish Harami is a two-day pattern where the primary candle is longer than the secondary candle.
The first day of the pattern's formation is especially bearish and usually occurs at the end of a downtrend. On the second day, bullish traders attempt to move the price up with little success as they still close lower than the opening price on the primary candle. This trading action is what provides us with the candlestick formation that forms the basis of the Bullish Harami. Let's take a look at how we might identify this particular candlestick pattern.
When attempting to identify a reliable Bullish Harami, you should look out for the following characteristics:
- The relevant security must be on a downtrend;
- The primary candle must be longer than the secondary candle;
- The primary candle should be bearish;
- The secondary candle must close higher than its open;
- The open of the secondary candle is higher than the close of the primary candle;
- The close of the secondary candle is lower than the open of the primary candle.
As you can see in the image above, all of the characteristics of the Bullish Harami are present in that particular chart leading to the temporary reversal of the downtrend. The chart above highlights the fact that while a Bullish Harami may correctly signal a reversal, there is no way to know how long that reversal may last. It is entirely possible for the reversal to be short-lived and the downtrend to quickly resume. Traders would be wise to set realistic profit targets and strict stop-loss orders on these pattern setups.
The Bullish Harami is confirmed on the third day if the price of the security one again closes higher. Cautious traders would likely wait for confirmation before entering a position on a Bullish Harami. However, when trading in the financial markets, you always need to evaluate your risk/reward ratio. Since Bullish Harami's may be short-lived, it is entirely possible that a large part of your reward has already passed by the time you enter your position. As such, traders with a higher risk tolerance may believe it is more prudent to enter the position near the close of the secondary candle. Ultimately, how you choose to trade these patterns is a personal choice depending on your own specific goals, strategies, and risk tolerance.
Bullish Engulfing
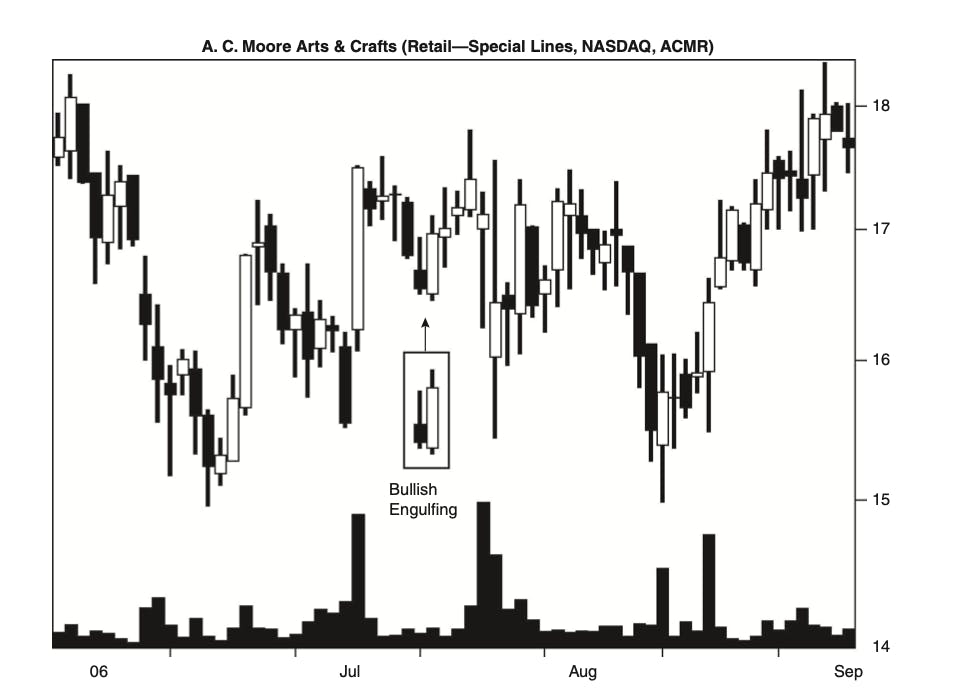
The Bullish Engulfing pattern is another two-day reversal pattern that signals the end of a downtrend and the beginning of an uptrend. The name of this pattern is taken from the makeup of the formation itself. As you can see, the secondary candle engulfs the primary candle with very bullish price action. As such, this pattern is known as a Bullish Engulfing pattern. Let's take a look at how we might identify a potential Bullish Engulfing pattern.
The main characteristics to look out for when attempting to identify this pattern are that the primary candle is bearish and proceeded by a much larger bullish candlestick the following day. To qualify as a valid Bullish Engulfing pattern, the following statements must also be true:
- The wick of the secondary candle is longer than the wick of the primary candle;
- The high of the secondary candle is higher than the high of the primary candle;
- The low of the secondary candle is lower than the low of the primary candle;
- The secondary candle is longer than the primary candle.
If all four of the statements above are correct and form during the course of a downtrend, you can reliably verify that you have identified a Bullish Engulfing pattern.
It should always be stressed that however accurately you identify a pattern, they do not always work. While Bullish Engulfing patterns are generally quite reliable, this universal truth still applies to Bullish Engulfing patterns, and they occasionally do fail.
As a general rule, you should consider the pattern to have failed if the low of the primary candle is violated. In other words, if the price action continues to trend below the level of the primary candle, the pattern has failed. As such, this is a good level to set your stop-loss order. However, some traders who adopt a more risk-on approach prefer to set their stop-loss orders at the bottom of the secondary candle giving them more maneuverability in the trade.
A Bullish Engulfing pattern is confirmed on the third day of the trade when the price action of the security continues upward, thereby confirming the trend reversal. The question is, therefore, when should you enter your trades? Cautious traders may enter their trades on the third day when the reversal has been confirmed. However, as you already know, this will inherently sacrifice some of their potential returns.
Those who prefer to take a more maverick approach to trading in financial markets may decide to enter their positions near the close of the secondary candle. For those of you who prefer this risk-on approach to trading, it would be useful to examine the volume near the end of the second day. If the volume is increasing along with the price, it is safer to assume that market sentiment has changed and that the following day will confirm the pattern.
While Bullish Engulfing patterns are potent trend reversal signals, they also have limitations. Firstly, the secondary candle can sometimes be significantly large. As a result, traders who prefer to place stop-loss orders at the bottom of the secondary candle may incur quite a high level of risk. Secondly, establishing a clear take-profit target can be challenging with a Bullish Engulfing pattern as the formation does not provide a clear price target. As such, traders will need to apply alternative means to identify a profit target when trading this candlestick pattern.
Bearish Engulfing
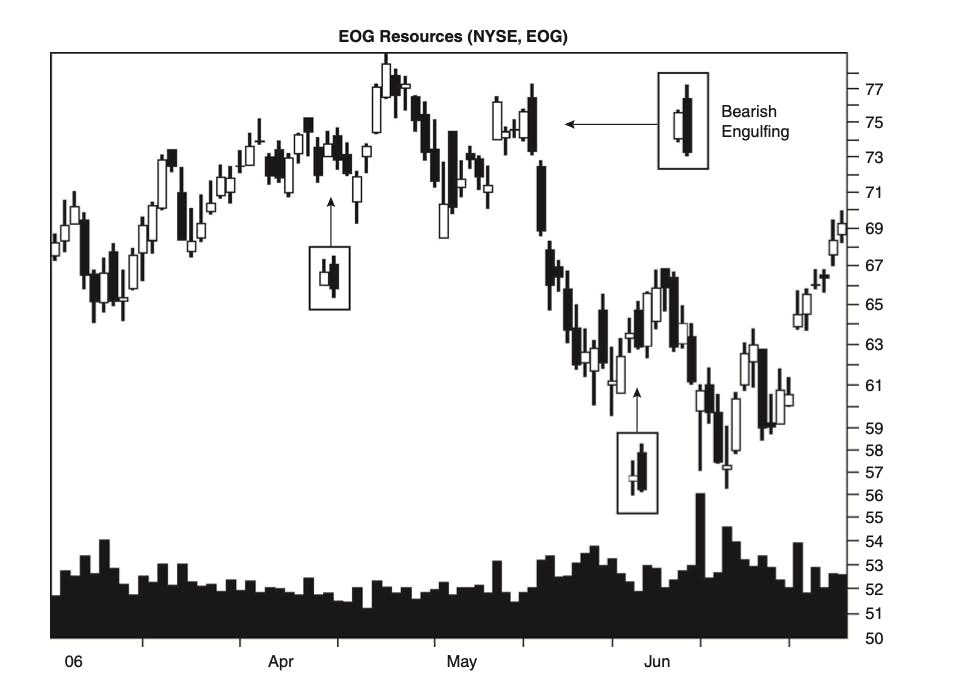
As you have likely guessed, the Bearish Engulfing pattern is the bearish counterpart of the Bullish Engulfing pattern discussed above. As the name suggests, the Bearish Engulfing pattern is a two-day pattern that signals the reversal of an uptrend leading to the start of a new downtrend.
The main characteristics to look out for when attempting to identify this pattern are that the primary candle is bullish and proceeded by a much larger bearish candlestick the following day. The pattern is considered to be most reliable when the opening price of the secondary candle is significantly above the close of the primary candle.
Similarly, the pattern is also more reliable the longer the uptrend has been trending. If the price action is choppy or the range-bound, it is likely that many Bearish Engulfing patterns will emerge, but they will likely either fail or result in weak price action and short-lived price falls.
Like its bullish counterpart, the Bearish Engulfing pattern is confirmed on the third day if the price action is bearish. Cautious traders will wait for this confirmation before their trades but will again sacrifice some of their returns if the pattern is successful. Likewise, traders who choose to adopt a more risk-on approach to trading can enter their positions near the close of the secondary candle. These traders would be well-advised to monitor the level of volume in the security as this will provide an insight into the reliability of the pattern.
When trading Bearish Engulfing patterns, it is typically best to place your stop-loss orders at the opening of the secondary candle. At this level, it would be fair to assume that bullish traders have again seized control of the price action, and the pattern will likely have failed.
When trading the Bearish Engulfing pattern and any other candlestick pattern, it is important to factor wider trends into your decision-making. For example, if the security is on a significant uptrend, then the Bearish Engulfing pattern may be more short-lived, especially if it does not have any other indicators supporting it.
However, if after a major downtrend, a security appears to be recovering and a Bearish Engulfing pattern emerges, this may be an excellent opportunity to enter a short position.
The limitations of this pattern are also similar to the ones faced by its bullish counterpart. Due to the potential size of the secondary candle, traders could potentially incur a large amount of risk if they choose to place their stop-loss orders at the bottom of the secondary candle. Similarly, establishing a clear take-profit target can be difficult with a Bearish Engulfing pattern as the formation does not provide a clear price target. As such, traders will again need to apply alternative means to identify a profit target when trading this candlestick pattern.
Three Advancing White Soldiers (AWS)
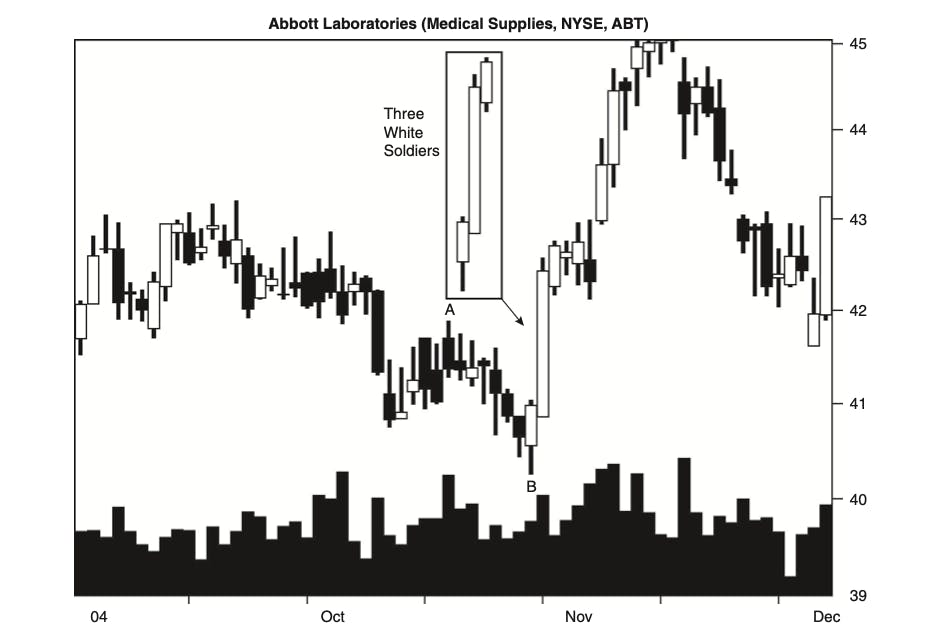
As you can see in the chart above, the AWS pattern consists of three bullish candles appearing in succession to each other. Typically, if this pattern forms during periods of weakness when a price is trending down or near a support line, it is a signal of meaningful strength ahead.
Locating an Advancing White Soldiers pattern is relatively simple as traders only need to look for a security that is trending down with three consecutive up days where the price closes positively. In order to qualify as an AWS pattern, the open, high, low, and close of the second day should be higher than the first. The same is also true of the third day and the second. This price action is usually quite dramatic and is a strong signal that the downtrend has now reversed, and bulls are now dominating the price action.
When trading the AWS pattern, you should note that strong upward moves in price may create temporary conditions where your RSI may display an overbought reading. Keep in mind that sharp moves higher may result in periods of consolidation in a security where it trades sideways for a time before ultimately continuing its upward move. As a result, traders who open positions following an AWS formation should prepare to be patient before seeing results.
As with every other pattern on our list, the AWS pattern is also not immune from failure. As such, traders should use other indicators such as moving averages or trend lines to confirm their theory before entering any positions.
Volume is one key metric to monitor when trading the AWS pattern. If the volume is low during the formation of the pattern, it is not likely that the rally will sustain for much longer as the price action is unsupported by sufficient volume. As a general rule, if the volume is low during the formation of the Advancing White Soldiers pattern, it is better to remember rule #1: when in doubt, get out!
If we assume that volume is high and other indicators support your theory, it remains recommended that you place a stop-loss order on any positions you enter. Concerning the AWS pattern, many traders prefer to place their stop-loss orders at the low of the pattern's second day. While this may appear to be quite a liberal stop-loss, oftentimes, there will be a small retracement after a significant climb in price. Since this is to be expected, a more liberal stop-loss placement allows room for the trade to play out in the event of a small retracement. A strict stop-loss order on an AWS formation that endures a retracement may end with the trader being stopped out of what is ultimately a profitable trade.
Final Tip
Now that you understand the basics of trading the top twelve candlestick patterns, you may be wondering how best to locate tradable patterns. Fortunately, there are free stock screeners available online that traders can employ to search and locate patterns they may wish to trade.
For example, once you believe you have mastered the Gravestone pattern, you can head to Tradingview to search for tradable Gravestone patterns. The screener will then locate any tradable patterns that fit your search criteria so you can examine them for possible trade opportunities.
Ideally, traders would spend the evening before their trading day analyzing the chart patterns they intend to trade, consulting relevant indicators, and determining stop-loss and take-profit placements before entering any positions. Traders should always remember rule #3: prior planning prevents poor performance.
Conclusion
Candlestick charts are among the most popular methods through which traders view price action. After reading about the insights they can offer regarding future price actions, I am sure it is not difficult to understand why.
However, if there is one takeaway from this article, it should be that candlestick patterns, while insightful, are not infallible. Perfectly formed patterns can, and often do, fail. For this reason, you should refrain from simply trading any patterns that form without first attempting to verify your theories through other indicators and charting tools.
It is vital to remember to evaluate your risk/reward on every trade, set stop-loss orders to protect yourself from adverse price moves, and plan your trades well before entering your positions.
*All images inside the guide are from the "Encyclopedia of Candlestick Charts" by Thomas Bulkowski